Intangible assets are those assets in a company’s balance sheet that have monetary or business value hidden in them but are not present in the physical form. Intangible assets help companies by performing operations in a unique manner thereby giving them a competitive edge. For example, intellectual property like patents, trademarks and copyrights are types of intangible assets. All businesses can gain access to intangibles by creating intangibles or acquiring intangibles from other businesses.
The intangible value of a business can also be hidden in the brand value of a corporation. Different businesses exhibit different Unique Selling Points that can be considered part of the intangible value of a business.
Below, we have collated the top valuable brands in the world.
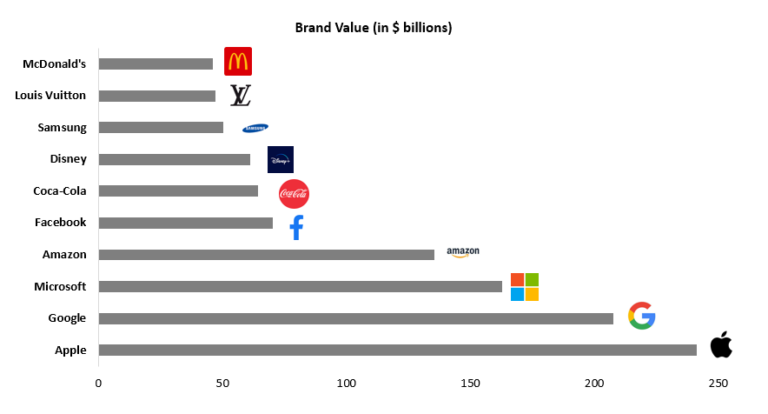
It is interesting to note that 5 out of the top 10 brands of the world belong to the Technology industry. This goes on to show us the penetration that the technology sector in making in our everyday lives.
Top Valuable Brands In India
| Name |
Brand Value (in $ billion) |
Unique Selling Point |
| TATA |
$21.283 |
Trust, Ethics |
| LIC |
$8.655 |
Market Leader, Data |
| Infosys |
$8.402 |
Data, Software |
| Reliance |
$8.138 |
Basket of businesses |
| HDFC Bank |
$6.588 |
Competitive Products |
Valuation of Top Indian Startups
| Name |
Brand Value (in $ billion) |
| Byju’s |
$18 |
| Paytm |
$9 |
| Oyo |
$9 |
| OlaCabs |
$6.3 |
| Zomato |
$5.4 |
The brand value these firms command can be attributed to different intangible factors. The TATA Group is known for its ethical business practices and trust whereas Infosys is known for its various technology related intangible assets and databases. Companies like Reliance and HDFC Bank have a brand image of their own since they have exhibited exponential growth over decades.
The recent influx of IPOs also goes on to show that intangibles are at play more than ever in today’s day and age. The IPOs of Zomato and Nykaa show us that in today’s times, the perception of the stock and the unseen potential of a company is also capable of giving it immense intangible value. This is one of the reasons that Zomato and Nykaa have almost the same market capital as Coal India, which is a monopoly with close to 70% market share in the coal business.
The chart below shows the increasing proportion of intangibles in the S&P 500 companies over the last 5 decades. It is a well-known fact that top technology companies like Microsoft, Apple boast of the highest value of intangibles in the world. Their intangibles include technology-based assets, marketing-based assets, contract-based assets and customer-related assets.
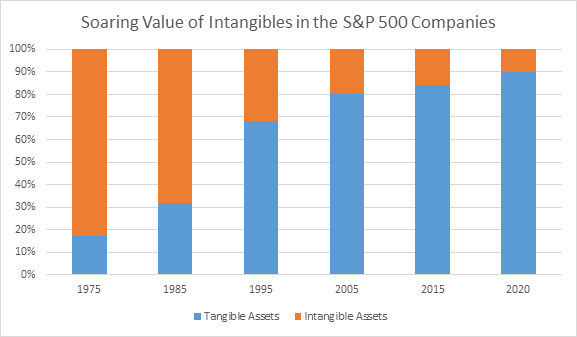
Source: Ocean Tomo Intellectual Capital Equity and IP CloseUp
Top 5 companies with the highest value of intangible assets

Over the last 4-5 decades, tangible assets have handed over the torch to intangible assets like intellectual property, brand, customer relationships and talent. Intangible assets currently account for 90% of the index’s total assets. This goes on to signify just how prevalent and essential intangibles have become for the survival and growth of a corporation. The companies that are able to extract value from these intangible assets in the future will change the world around us.
READ MORE
WHY Intangibles Valuation is Important?
There can be different reasons to value intangibles; some of them are listed below –
- Determining the Asset Value Since an intangible asset is a non-physical asset, the value at which it has to be disclosed should be determined as accurately as possible.
- Regulatory Purposes Determining the correct value of the intangible asset for taxation purposes, transfer pricing, taxation for mergers and acquisitions etc.
- Improving Accuracy and Reliability of Financial Communication Informing stakeholders (management, employees, shareholders, regulators, etc) appropriately and reliably is of paramount importance in today’s day and age.
- Improving and Diversifying Access to Finance Recognizing the worth and inherent value of intangible assets would greatly improve the chances of any company to successfully apply for financing.
- Impairment Testing Impairment testing involves comparing an asset’s carrying amount in the balance sheet with its recoverable amount.
- Gaining competitive edge An increase in intangibles investment may trigger an increase in total factor productivity, and therefore long-term economic growth.
Common Intangible Assets
There are many types of intangible assets, but they are often considered to fall into one or more of the following categories (or goodwill):
Marketing-related intangible assets
- Trade marks (eg. McDonald’s logo with gold M symbol, Nike logo)
- Internet domain names (eg. www.google.com, www.yahoo.com)
- Non-competition agreements

Customer-related intangible assets
- Customer lists (eg. Tata Motors’ database of clients)
- Customer contracts (eg. Apple’s contracts with customers)
- Customer relationships
Artistic-related intangible assets
- Plays (eg. The Lion King play)
- Books (eg. Harry Potter books)
- Pictures (eg. Van Gogh’s paintings)

Contract-based intangible assets
- Licensing, royalty agreements (eg. Lending a license for use)
- Leasing agreements (eg. Leasing agreement to use an asset)
- Broadcasting rights (eg. Hotstar’s right to broadcast IPL)

Technology based intangible assets
- Patented and unpatented technologies
- Software (eg. Microsoft Office)
- Databases
- Secret formulas, processes (eg. Confidential code of a product)
REGULATORY ASPECT
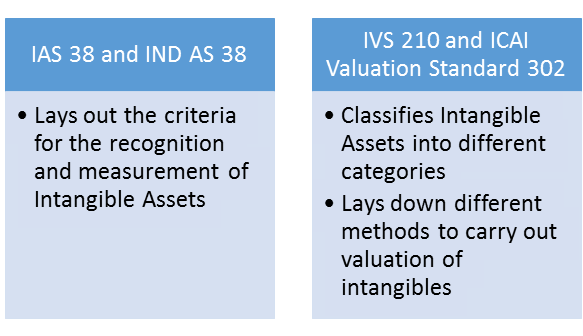
Recognition and Measurement of Intangible Assets as per IAS 38 and IND AS 38
- The recognition of an asset as an intangible asset can only be done if an entity can prove that the asset meets the definition of an intangible asset and the recognition criteria. This requirement applies to costs incurred initially to acquire or generate an asset or those incurred subsequently.
- The intangible asset should be recognized only if it is probably that the expected future economic benefits that are connected to the asset will flow to the entity and the cost of the asset can be measured reliably. If the criteria for recognition is not met, the expenditure will be recognized as an expense.
- Two types of asset life have been mentioned in the standard – finite life and infinite life. If life is finite, the asset should be amortized over the useful life and impairment test should be done appropriate. In case of infinite life, test for impairment should be done annually and whenever there is an indication that the asset may be impaired.
- The following disclosure requirements are prescribed in the standards:
- (a) useful life or amortization rate
- (b) amortization method
- (c) gross carrying amount
- (d) accumulated amortization and impairment losses
- (e) line items in the income statement in which amortization is included
Valuation of Intangible Assets under IVS 210 and ICAI Valuation Standard 302
- The standards broadly prescribe the methods and various ways by which Intangible Assets shall be valued.
- Intangible assets should be able to generate quantifiable economic benefits for the Company and can either be developed internally or purchased. Common examples of items of intangible assets are computer software, patents, copyrights, trademarks and brands among others.
- The standard prescribed the following three approaches for valuation of intangibles:
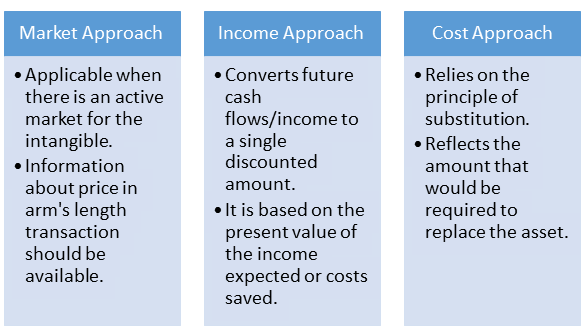
Owing to the unique nature of intangibles, the questions of how to value intangible assets ultimately comes down to choosing the right method for valuation.
The five primary valuation methods are based on the three approaches described above – the market, income and cost approaches. While valuing a particular intangible asset, one method will likely be more appropriate compared to the others. The five methods used in the valuation of intangibles are described below.
1) Relief from Royalty Method (RRM)
In this method, value is assigned to the intangible asset based on approximate royalty rates that would be saved by owning the asset. Because the asset is owned by the Company, it doesn’t have to pay for the use of the asset. The RRM incorporates elements of both the market (royalty rates for comparable assets) and income (estimates of revenue, growth, tax rates) approaches.
Example
|
Year 1 |
Year 2 |
Year 3 |
Year 4 |
Year 5 |
| Revenues (in Rs. Crores) |
1000 |
1200 |
1400 |
1600 |
1800 |
| Royalty Rate |
5% |
5% |
5% |
5% |
5% |
| Royalty Savings |
50 |
60 |
70 |
80 |
90 |
| Tax |
10% |
10% |
10% |
10% |
10% |
| After Tax Royalty Savings |
45 |
54 |
63 |
72 |
81 |
| Discount Factor |
0.9 |
0.82 |
0.75 |
0.68 |
0.62 |
| Discounted Royalty Savings |
40.5 |
44.28 |
47.25 |
48.96 |
50.22 |
The value of the intangible asset can thus be calculated as Rs. 231.21 crores – which is the sum of discounted royalty savings for the 5 years.
2) With and Without Method (WWM)
The intangible asset’s value is determined by calculating the difference between a discounted cash flow model for the enterprise with the asset and a discounted cash flow model without the asset.
It should be noted that identification of incremental income and incremental risk to business cost of capital excluding the capital is of paramount importance here.
3) Multi-Period Excess Earnings Method (MPEEM)
The cash flows related to a particular intangible asset are discounted to calculate the present value. It is applied when the cash flows associated to a particular intangible asset can be properly determined. Software and customer relationships are examples of assets that can be valued using MPEEM.
Example
| Particulars |
Amount |
| Working Capital |
$500,000 |
| Fixed Assets |
$1,000,000 |
| Normalized Earnings |
$150,000 |
| Required return for Working Capital |
5% |
| Required return for Fixed Assets |
10% |
| Required Earnings |
|
| Working Capital |
$25,000 |
| Fixed Assets |
$100,000 |
| Total Required Earnings |
$125,000 |
| Value of Intangibles ($150,000-$100,000) |
$25,000 |
As seen in the example above, the value of the intangibles is calculated as $25,000 since the excess earnings above the required rate of return on capital.
4) Real Option Pricing
This method is used to value intangible assets that are not presently generating cash flows but are expected to do so in the future. Undeveloped patent options are one example of an intangible asset that may be valued using this method.
Example
|
Year 1 |
Year 2 |
Year 3 |
| Profit from Patent (in Rs. Crores) |
1000 |
2000 |
3000 |
| Tax |
20% |
20% |
20% |
| Profit After Tax |
800 |
1600 |
2400 |
| Discount Rate 10% |
0.9 |
0.82 |
0.75 |
| Discounted PAT |
720 |
1312 |
1800 |
The value of the patent by this method comes out to be Rs. 3832 crores, which is the summation of the discounted PAT of the three years.
5) Replacement Cost Method Less Obsolescence The replacement cost method establishes a value for the intangible based on the amount is would cost the Company to replace the asset.
Real World Intangible Assets
- When Walmart acquired Flipkart, Walmart attributed 77% of Flipkart’s $24.1 billion in assets to intangibles and goodwill, highlighting the premium the US retail company paid. The goodwill arising from the acquisition consisted largely of anticipated synergies and economies of scale primarily related to procurement and logistics. Flipkart’s procurement and logistics network was seen as a competitive edge which was very difficult for others to inculcate in their business. Therefore, a large value was assigned to it during the transaction.
- This year’s number one Company in terms of total estimated intangible value is Microsoft ($1.90 trillion), which has jumped from 4th position in 2020 to overtake Apple, Saudi Aramco and Amazon. A big reason for this is the adoption of Microsoft Teams since the beginning of the pandemic. Microsoft Teams has become embedded into business life for global organizations, once again proving the value of Microsoft’s ability to innovate and roll-out at scale. Although Apple is the more valuable company, Microsoft is estimated to have more intangible value with its portfolio of brands and business operations.
- Management consultancy firms like Mckinsey, BCG, Accenture, etc. accumulate intangibles in the form of clients and human capital over the years. Satisfied clients ensure that these firms can develop long term associations with them. This may not be explicitly showcased in the balance sheet but it is essential to the growth and progress of the firm.
CONCLUSION
Despite of all the guidance and standards available for intangible valuations, Intangible Valuations tends to be a highly subjective activity.
The evolution and evaluation of the intangible assets of a company is an integral part of the analysis of a company. A large number of technology and service-based companies are heavily reliant on intangible assets while performing their business functions, thereby giving them immense importance in this day and age.
The real challenge in intangible valuations lies in determining how much portion of value is attributable to a number of tangible and intangible assets.
Therefore, it should be noted that the value is within the prescribed framework under law while exercising structured and practical thinking in relation to the benefit that can be derived from intangibles.
It is of no doubt that going forward, Companies that are able to accumulate and harness Intangibles will be able to create more value.